Up and Running with Excel
Have queries? Ask us
- +880 1790-267575
The Analytic Hub Up and Running with excel Training will help you gain expertise in Business Analytics. You will master concepts such as Power BI Desktop, Architecture, DAX, Service, Mobile Apps, Reports, and Q&A, to name a few, with industry use cases. This Power BI Course is live instructor-led and ensures that you get hands-on experience in real-time projects. Learn Power BI online from 10+ years of experienced industry experts and clear the PL-300 exam.
- Live Online Classes Every Month
Flexible batches for you

Only
Save 10% with promo Code: AH10
Excel Mastery Course
Transform Your Data Skills with Microsoft Certified Trainer Samiul Huq
- Live Online Classes starting on May 30, 2025


Course Overview
Boost your Excel skills from basic to advanced levels with this comprehensive course designed specifically for professionals, students, and freelancers. Under the expert guidance of Samiul Huq, a Microsoft Certified Trainer with decades of experience, you will master practical, real-world applications of Excel that will elevate your data management and analysis expertise to new heights.
Meet Your Instructor: Samiul Huq
Microsoft Certified Trainer (MCT)
Over 10 years of corporate training experience
Trained 3,000+ professionals globally
Consulted for leading companies like Unilever Indonesia and JTI
What I will learn?
- With newer tools emerging every day to help solve the crisis of data management, most organizations have already moved in or have plans to use Business Intelligence in solving their crisis. Power BI is one of the most popular BI tools offered by leading software giant Microsoft mainly aimed to help everyone analyze and visualize their data.
Course Curriculum
Handling Text with Formulas and Built in Tools
Add a summary of short text to prepare students for the activities for the topic. The text is shown on the course page beside the tooltip beside the topic name.
Day one
Drag the Fill Handle
00:00- 00:00
Joining Text
00:00Rapid Formula Copy
00:00Convert to Proper Case
00:00Formulas to Values
00:00Breaking Apart Text
00:00Parsing Fixed Width
00:00
Diving into Formulas
Add a summary of short text to prepare students for the activities for the topic. The text is shown on the course page beside the tooltip beside the topic name.
AutoSum Tricks
00:00Day 2
Relative Versus Absolute Formulas
Tables and Table Formulas
00:00Goal Seek
00:00
Diving into Formulas Advanced
IF Formulas
00:00Lookups
00:00Date and Time
00:00SumIfs
00:00Day 3
Charting and SmartArt
Creating and Formatting a Chart
00:00Adding or Removing Chart Data
00:00Saving Favorite Chart Settings
00:00Charting Differing Orders of Magnitude
00:00Pie Chart Tricks
00:00Sparklines
00:00Creating SmartArt
00:00Day 4
Visual Impact
Color Scales, Icon Sets, Data Bars
00:00Icons for Only a Subset
00:00Paired Bar Charts with Negative Data Bars
00:00
Sorting & Filtering
Data Preparation
00:00One-Click Sorting
00:00Sorting by Color
00:00Filter by Selection
00:00Other ways to Filter
00:00Day 5
Pivot Table
Pivot Table Begins
00:00Changing and Updating a Pivot Table
00:00Pivot Table Design and Chartings
00:00Adding Slicer the New Filter
00:00Muliple Slicer
00:00Top 5 Customers
00:00Adding Timeline and Spicing up the Dashoard
00:00Show Min Max Average and Percentage
00:00Spice up your pivot table with Conditional Formatting
00:00Calculated Fields
00:00Get Pivot is not evil
00:00Drill Down Feature
00:00Grouping Data
00:00Generate 20 Reports in Just couple of clicks
00:00
Advanced Pivot Tables
Data Consolidation in Pivot Table
00:00Join Multiple tables using data model
00:00Find Unique Items through data model
00:00
PowerPivot
What is BI
00:00What is powerpivot
00:00Why PowerPivot
00:00Exploring the PowerPivot Options
00:00Dax Version of Sumif
00:00Actual vs Budget Report
00:00
Power Query (Now Data Import)
Import Data from a Folder
00:00
Import Data using Load To Option
Importing Data from a folder
00:00Clean Your Unstructured Data through Data Transform
00:00
Recording Macros
Displaying the Developer Tab
00:00Recording a Simple Macro
00:00Simplifying the Macro
00:00Keys to Successful Recording
00:00
Solver
Solver Setup
00:00What if Scenario
00:00
Tips & Tricks
Removing Duplicates
00:00Copying Sheets
00:00Working In Group Mode
00:00Excel as word processor
00:00Text Box Trick
00:00Shrink Text
00:00Transposing Tricks
00:00Insert Blank Rows
00:00Hide Data
00:00Important Sheet
00:00Data Validation
00:00Fill up in the sideways
00:00Switch Column Trick
00:00Fill Blank Trick
00:00Pick from List
00:00Formula to Value
00:00F4 trick
00:00Format Part of Cell
00:00Print Small Selection
00:00Fit to One Page Trick
00:00Speak Cells
00:00
Earn a certificate
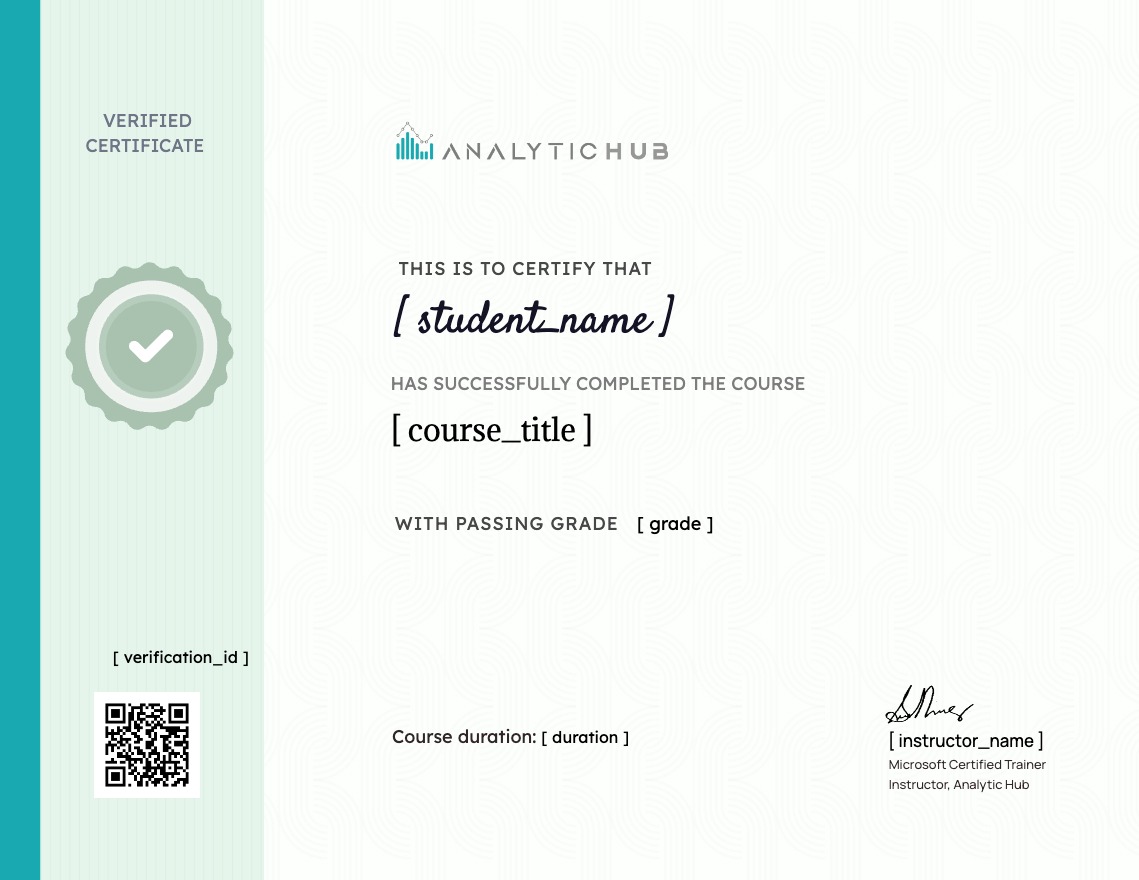
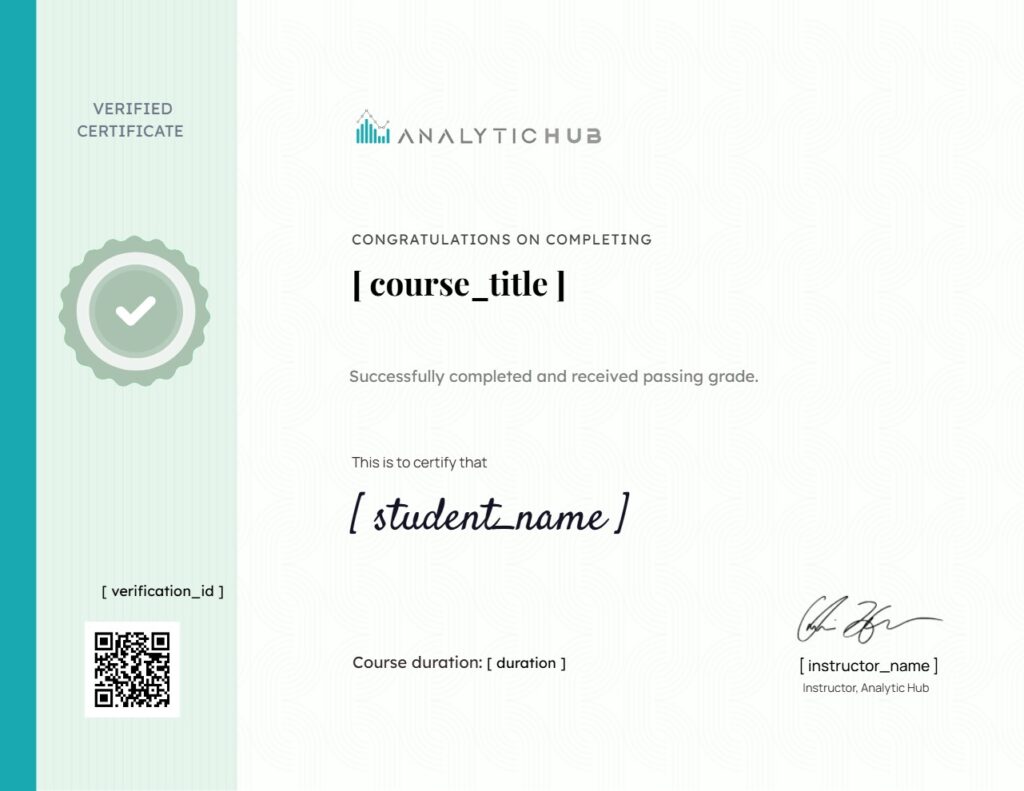
Add this certificate to your resume to demonstrate your skills & increase your chances of getting noticed.

Student Ratings & Reviews

- LevelAll Levels
- Total Enrolled2
- Duration30 hours
- Last UpdatedMay 21, 2025
- CertificateCertificate of completion
Target Audience
- General
Material Includes
- Course Notes- PDF
- Study guidelines
- Live class integrated
- Recorded video resources
Requirements
- Windows Laptop or desktop
- Microsoft Excel Sofware
- Stable Internet Connection
Tags
What You’ll Learn
- Master Excel's Core & Advanced Functions
- Turn Raw Data into Visual Stories
- Automate Repetitive Tasks with Macros & Solver
- Use Power Tools: Power Query, Pivot, Power Pivot

Why enroll for Business Intelligence with excel Certification Course?
Microsoft is recognized as a leader in the Gartner Magic Quadrant for Analytics and Business Intelligence Platforms for 12 consecutive years
Cognizant, Dell, KPMG, Hitachi, Wipro, Avanade, Annik Inc, Brillio and 45,000 MNCs across 185 countries use Power BI
The average salary for a business intelligence developer is $104,604 per year in the United States – Indeed.com
Business Intelligence with excel Course Benifits
With newer tools emerging every day to help solve the crisis of data management, most organizations have already moved in or have plans to use Business Intelligence in solving their crisis. Power BI is one of the most popular BI tools offered by leading software giant Microsoft mainly aimed to help everyone analyze and visualize their data.
Why Business Intelligence with excel Course from Analytic Hub?
- Live Interactive Learning
- World-Class Instructors
- Expert-Led Mentoring Sessions
- Instant doubt clearing
- Lifetime Access
- Course Access Never Expires
- Free Access to Future Updates
- Unlimited Access to Course Content
- 24x7 Support
- One-On-One Learning Assistance
- Help Desk Support
- Resolve Doubts in Real-time
- Hands-On Project Based Learning
- Course Demo Dataset & Files
- Expert-Led Mentoring Sessions
- Quizzes & Assignments
- Industry Recognised Certification
- Edureka Training Certificate
- Graded Performance Certificate
- Certificate of Completion
- 24x7 Support
- One-On-One Learning Assistance
- Help Desk Support
- Resolve Doubts in Real-time
About your Business Intelligence with excel Certification Course
Business Intelligence with excel Skills Covered
- Desktop Layout
- Charts and Page Layout
- Data Transformation
- Reports and Dashboards
- DAX Commands
- Advanced Analytics
Business Intelligence with excel Training Course Overview
Prior technical knowledge is optional for this Power BI Training Course. However, a fundamental understanding of Microsoft Excel, R, and Python Scripts will be an advantage. To help you brush up on concepts of R and Python Scripts, we will provide self-paced videos that are absolutely free in your LMS.
Power BI is a business analytics service provided by Microsoft. It provides interactive visualizations with self-service business intelligence capabilities, where end users can create reports and dashboards by themselves without having to depend on any information technology staff or database administrator. Power BI certification course shares knowledge on how it provides cloud-based BI services – known as Power BI Services, along with a desktop-based interface called Power BI Desktop. It offers Data modeling capabilities including data preparation, data discovery, and interactive dashboards.
- Entry-level Professionals
- Business Analysts
- Business Intelligence Manager
- Statisticians and Analysts
- Data Scientists
- Project Managers
Business Intelligence with excel Course Project

Industry: Retail Sector
Global Super Store is an online supergiant store that has worldwide operations. This store takes orders and delivers products across the globe and deals with all the major produc....

Industry: Sales & Finance
PEW Retail Inc. Ltd has subsidiaries across the globe, and they sell products to various customers scattered in different geography. They are looking to have a consolidated dashb....
Business Intelligence with excel: Excel Data Analyst Associate
Upon successfully completing the Power BI Course, Analytic Hub Provides the course completion certificate for Power BI. And its validity is a lifetime.
To unlock the Analytic Hub Power BI course completion certificate, You must complete at least one full session and finish the course as part of your Power BI training by having a minimum score of 80% during the simulation test.
Power BI certification exams test your following skills:
Prepare the data (20-25%)
Model the data (25-30%)
Visualize the data (20-25%)
Analyze the data (10-15%)
Deploy and maintain deliverables (10-15%)
Business Intelligence with excel Training FAQs
Power BI is a BI tool for analytics. This tool allows users to aggregate and share data with reports, visualizations, and other analytics tools. It helps you create reports and charts for business insights. Power BI is available in Windows desktop app, online cloud-based software as a service, a report builder, a report server, a visual marketplace, and mobile apps for Windows, iOS, and Android tablets and smartphones.
Microsoft Power BI is a popular choice among business intelligence tools because it is easy to understand, even for non-technical professionals. Users don’t need advanced skills in data analytics or engineering to use it.
Yes, access to the Power BI Training Course material will be available for a lifetime once you have enrolled in the course.
Yes, Power Query is a significant part of the Power BI course syllabus. Participants learn to use Power Query for data transformation, cleaning, and shaping before importing it into Power BI.
A Power BI Developer is a professional who specializes in using the Power BI toolset to design, develop, and implement business intelligence solutions. They create interactive reports, dashboards, and data visualizations to help organizations make data-driven decisions.
Our learner says...


Pricing and Enrollment
Master Data Analysis with Excel
- LevelAll Levels
- Total Enrolled2
- Duration30 hours
- Last UpdatedMay 21, 2025
- CertificateCertificate of completion
Why Choose Us
- Affordable pricing
High-quality training at a cost that fits your budget.
- Live, interactive sessions
Engage directly with the instructor for a hands-on learning experience.
- Microsoft-certified instructor
Learn from an expert with globally recognized credentials.
- Industry-relevant curriculum
Practical lessons tailored to real-world business needs.

About the Instructor

10+ years
3,000 +
Student
Microsoft
Certified
Trusted by Industry Leaders
Our proven methods and expertise have been trusted by professionals and companies worldwide.


Microsoft Excel Training FAQs
Nope! This course is beginner-friendly. Whether you’re starting from scratch or want to level up, you’ll learn everything step-by-step.
Yes! Upon completion, you’ll get a professionally recognized certificate that you can showcase on your CV or LinkedIn.
All sessions are conducted LIVE on Zoom for real-time learning, but you’ll also get access to session recordings to revise anytime.
Just Microsoft Excel (2016 or later) and a stable internet connection. That’s it, no fancy setup required.
You’ll receive 1:1 mentorship, feedback on your progress, and access to a supportive learning community throughout the course.
Share Your Info to Learn More
Secure your spot now. Transform your career with expert-led training!


