
The Straight Path Leadership
Have queries? Ask us
- +880 1711223344
The Analytic Hub Power BI Training will help you gain expertise in Business Analytics. You will master concepts such as Power BI Desktop, Architecture, DAX, Service, Mobile Apps, Reports, and Q&A, to name a few, with industry use cases. This Power BI Course is live instructor-led and ensures that you get hands-on experience in real-time projects. Learn Power BI online from 10+ years of experienced industry experts and clear the PL-300 exam.
- Live Online Classes starting on 14 Oct 2024
Flexible batches for you
Only
Free Enrollment
Course Curriculum
Orientation Class
-
Orientation Class
Course Introduction
Second Foundation: Mental Models
Third Foundation: Balance
Fourth Foundation: Emotional and Spiritual Bank Account
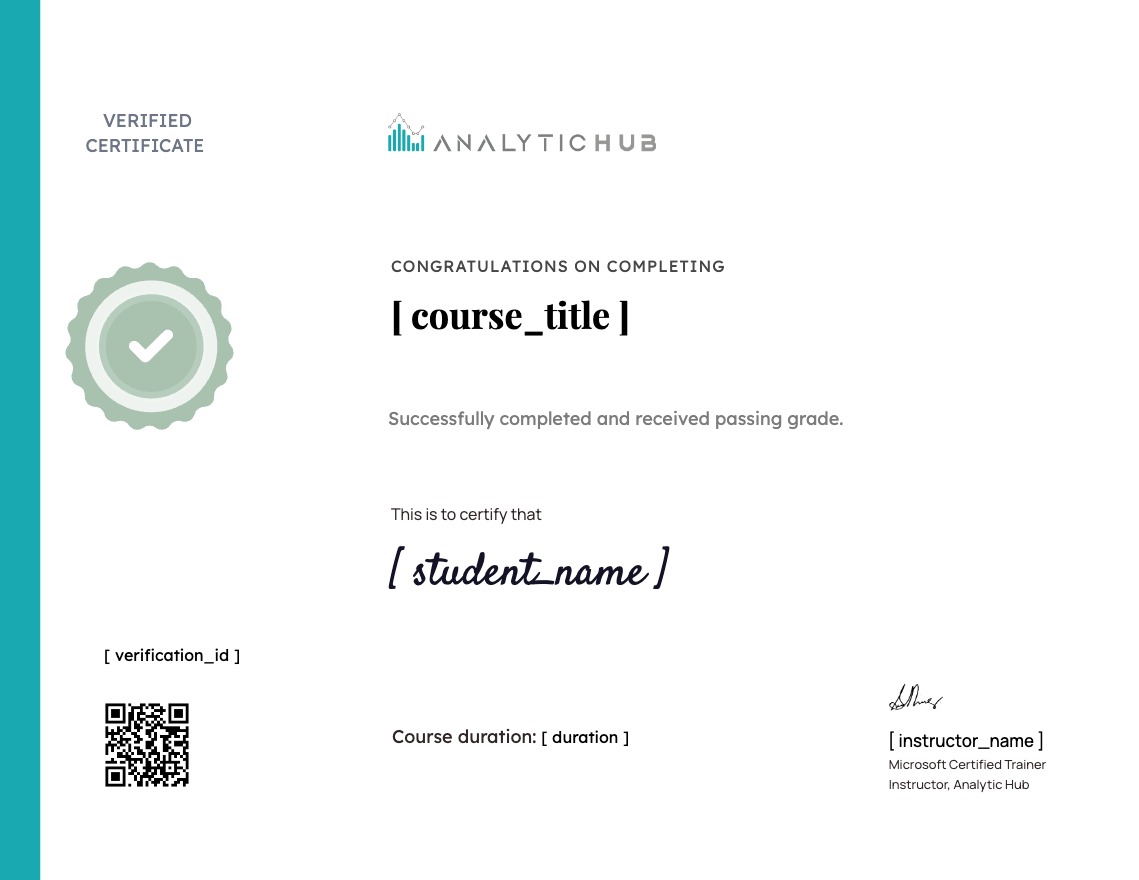
Earn a certificate
Add this certificate to your resume to demonstrate your skills & increase your chances of getting noticed.
Student Ratings & Reviews

Requirements
- Need steady Internet connection of Live Classes
Target Audience
- Corporate
Material Includes
- Desktop
- Internet
- Power BI Desktop
Why enroll for Microsoft Power BI Certification Course?
Microsoft is recognized as a leader in the Gartner Magic Quadrant for Analytics and Business Intelligence Platforms for 12 consecutive years
Cognizant, Dell, KPMG, Hitachi, Wipro, Avanade, Annik Inc, Brillio and 45,000 MNCs across 185 countries use Power BI
The average salary for a business intelligence developer is $104,604 per year in the United States – Indeed.com
Power BI Course Benifits
With newer tools emerging every day to help solve the crisis of data management, most organizations have already moved in or have plans to use Business Intelligence in solving their crisis. Power BI is one of the most popular BI tools offered by leading software giant Microsoft mainly aimed to help everyone analyze and visualize their data.
Why Microsoft Power BI Course from Analytic Hub?
- Live Interactive Learning
- World-Class Instructors
- Expert-Led Mentoring Sessions
- Instant doubt clearing
- Lifetime Access
- Course Access Never Expires
- Free Access to Future Updates
- Unlimited Access to Course Content
- 24x7 Support
- One-On-One Learning Assistance
- Help Desk Support
- Resolve Doubts in Real-time
- Hands-On Project Based Learning
- Course Demo Dataset & Files
- Expert-Led Mentoring Sessions
- Quizzes & Assignments
- Industry Recognised Certification
- Edureka Training Certificate
- Graded Performance Certificate
- Certificate of Completion
- 24x7 Support
- One-On-One Learning Assistance
- Help Desk Support
- Resolve Doubts in Real-time
About your Microsoft Power BI Certification Course
Power BI Skills Covered
- Desktop Layout
- Charts and Page Layout
- Data Transformation
- Reports and Dashboards
- DAX Commands
- Advanced Analytics
Power BI Training Course Overview
Prior technical knowledge is optional for this Power BI Training Course. However, a fundamental understanding of Microsoft Excel, R, and Python Scripts will be an advantage. To help you brush up on concepts of R and Python Scripts, we will provide self-paced videos that are absolutely free in your LMS.
Power BI is a business analytics service provided by Microsoft. It provides interactive visualizations with self-service business intelligence capabilities, where end users can create reports and dashboards by themselves without having to depend on any information technology staff or database administrator. Power BI certification course shares knowledge on how it provides cloud-based BI services – known as Power BI Services, along with a desktop-based interface called Power BI Desktop. It offers Data modeling capabilities including data preparation, data discovery, and interactive dashboards.
- Entry-level Professionals
- Business Analysts
- Business Intelligence Manager
- Statisticians and Analysts
- Data Scientists
- Project Managers
Power BI Course Project

Industry: Retail Sector
Global Super Store is an online supergiant store that has worldwide operations. This store takes orders and delivers products across the globe and deals with all the major produc....

Industry: Sales & Finance
PEW Retail Inc. Ltd has subsidiaries across the globe, and they sell products to various customers scattered in different geography. They are looking to have a consolidated dashb....
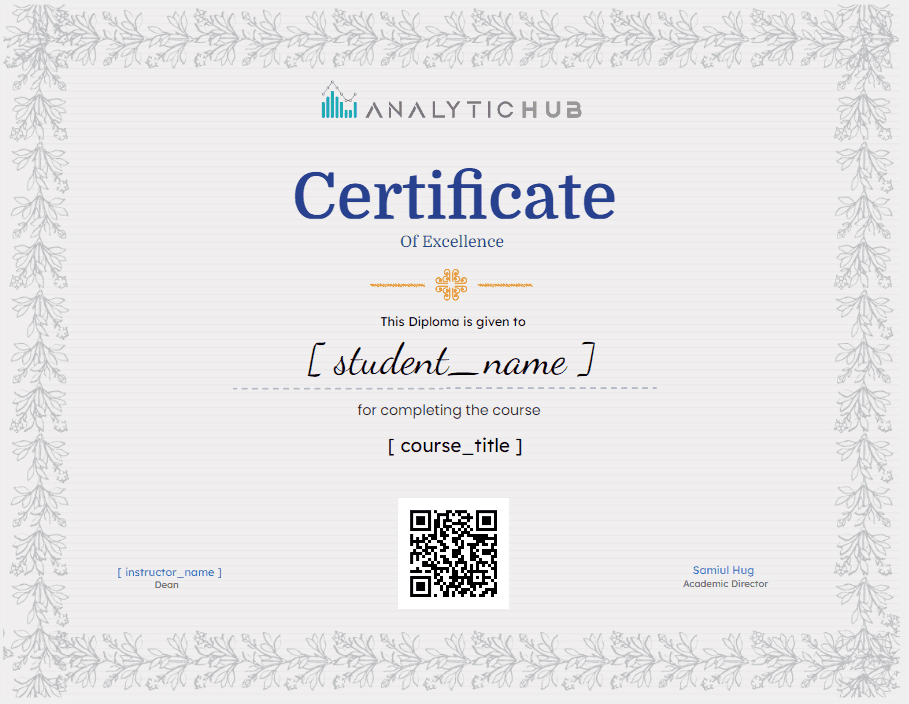
Power BI Certification: Power BI Data Analyst Associate
Upon successfully completing the Power BI Course, Analytic Hub Provides the course completion certificate for Power BI. And its validity is a lifetime.
To unlock the Analytic Hub Power BI course completion certificate, You must complete at least one full session and finish the course as part of your Power BI training by having a minimum score of 80% during the simulation test.
Power BI certification exams test your following skills:
Prepare the data (20-25%)
Model the data (25-30%)
Visualize the data (20-25%)
Analyze the data (10-15%)
Deploy and maintain deliverables (10-15%)
Microsoft Power BI Training FAQs
Power BI is a BI tool for analytics. This tool allows users to aggregate and share data with reports, visualizations, and other analytics tools. It helps you create reports and charts for business insights. Power BI is available in Windows desktop app, online cloud-based software as a service, a report builder, a report server, a visual marketplace, and mobile apps for Windows, iOS, and Android tablets and smartphones.
Microsoft Power BI is a popular choice among business intelligence tools because it is easy to understand, even for non-technical professionals. Users don’t need advanced skills in data analytics or engineering to use it.
Yes, access to the Power BI Training Course material will be available for a lifetime once you have enrolled in the course.
Yes, Power Query is a significant part of the Power BI course syllabus. Participants learn to use Power Query for data transformation, cleaning, and shaping before importing it into Power BI.
A Power BI Developer is a professional who specializes in using the Power BI toolset to design, develop, and implement business intelligence solutions. They create interactive reports, dashboards, and data visualizations to help organizations make data-driven decisions.
Our learner says...