









Power BI Master Class – Batch 8
Take your career from Excel to Expert Insights
Master data analytics in weeks, not month; no prior experience needed
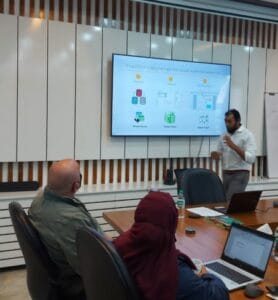
Join Power BI Master Class – Batch 8 with Samiul Huq, trusted by 4000+ learners worldwide.
- Live Online Classes starting on October 04, 2025
Why This Course Matters
In Bangladesh’s rapidly evolving job market, companies now expect more than basic Excel skills. Smart organizations rely on Power BI for real-time dashboards, automated reporting, and meaningful data insights.
If you can transform raw data into visual stories and decision-driving dashboards, you don’t just keep up, you get ahead.
What You’ll Learn (Course Highlights)
Over 2 weeks of live, interactive training with hands-on projects, you’ll:
Import, clean & transform data (including from Excel, databases)
Build compelling visualizations: charts, maps, slicers, cards, dashboards
Master DAX expressions & time intelligence functions
Automate reports and share dashboards
Use Power BI Service for web publishing & live sharing
Get live Q&A sessions and class assignments to practice
Course Curriculum Overview
Course Curriculum
Class 1: Introduction
• Histroy
• How to Download and Install
• Why PowerBI
• PowerBI Introduction
• How to import data
• Explore Data Tab
• Explore Data Models
• Understand why use excel table for naming phenomenon
• Explore visuals, tables, charts, cards, slicers
• Learn how to format the visuals
-
Orientation Class- Live
-
Understand the History of PowerBI
00:00 -
How to Download and Install PowerBI
00:00 -
When and Why we Need PowerBI
00:00 -
PowerBI Introduction
00:00 -
Explore how to import Data
00:00 -
Where did my Data go!
00:00 -
How do we Join multiple tables?
00:00 -
Why Naming a Table is a good idea while importing from Excel
00:00 -
Exploring the visuals!
00:00 -
How do i now format my visuals?
00:00
Class 2: Data Visualization in Depth
Topic titles are displayed publicly wherever required. Each topic may contain one or more lessons, quiz and assignments.
-
We can harness the power of Ai in Visual
00:00 -
Yes We can do Maps!
04:34 -
My Favourite Visual!
00:00 -
Learn to Add Trend Lines and Forecast
00:00 -
How to do a Report like Pivot Table?
00:00 -
How do i visualize four dimension data?
00:00 -
Calculating the percentage of total
00:00 -
Coloring Up the data with Conditions
00:00 -
I got data from SQL, now how do i export it to Excel?
00:00 -
how to get 1000 visual?
00:00 -
How to Group and Bin?
00:00
Class 3: Filtering in PowerBI
How Filter Works in PowerBI
-
There are Three kinda Filter!
00:00 -
Apply Filter to all my pages!
00:00 -
How to find Top 10 Item like Excel?
00:00 -
The Most Practical Setting of Slicer
00:00 -
Bookmark, a different kind of filter!
00:00
Class 4: Extract and Transform with PowerBI
Clean and Automate!
-
First thing First: How do i Update my Data?
00:00 -
Lets learn to load data from a folder to automate
00:00 -
How do i transformation my Ugly Data set
00:00 -
Learn to Unpivot Data
00:00 -
What’s the difference between Append and Merge?
00:00 -
Do Data Quality like a Data Scientist!
00:00
Class 4: DAX
-
How do we vLookup in PowerBI?
00:00 -
PowerBI if() is so cooler than excel!
00:00 -
Yes we can do if in PowerQuery as well!
00:00 -
Calculate the most powerful funtion to replace Sumifs!
00:00
Class 5: Advance DAX and Measures
-
Why Smart user uses Calandar Table?
00:00 -
Lets use some Time Intelligence Functions!
00:00 -
How do we use Calculated Field in PowerBI?
00:00 -
How do we use Calculated Field in PowerBI?
00:00 -
Using Copilot to write my DAX in PowerBI
00:00
Class 6 PowerBI Service
-
Why do i need PowerBI Service?
00:00 -
Publish the report on Web
00:00 -
Dashboard is actually different in PowerBI Lingo!
00:00 -
Ask Questions to Dashboard
00:00 -
Don’t have widnows? No Problem!
00:00 -
How do i set Permission?
00:00 -
Analyze with Excel
00:00 -
Yes we can now do live interaction from PowerPoint!
00:00
Class 7 PowerBI Service Advance
-
How do i automate my data in PowerBI Service?
00:00 -
Getting Smarter Using PowerBI Mobile App
00:00 -
There is another kind of App! Its PowerBI App
00:00 -
Yes, we can embed PowerBI Report in Web As well!
00:00
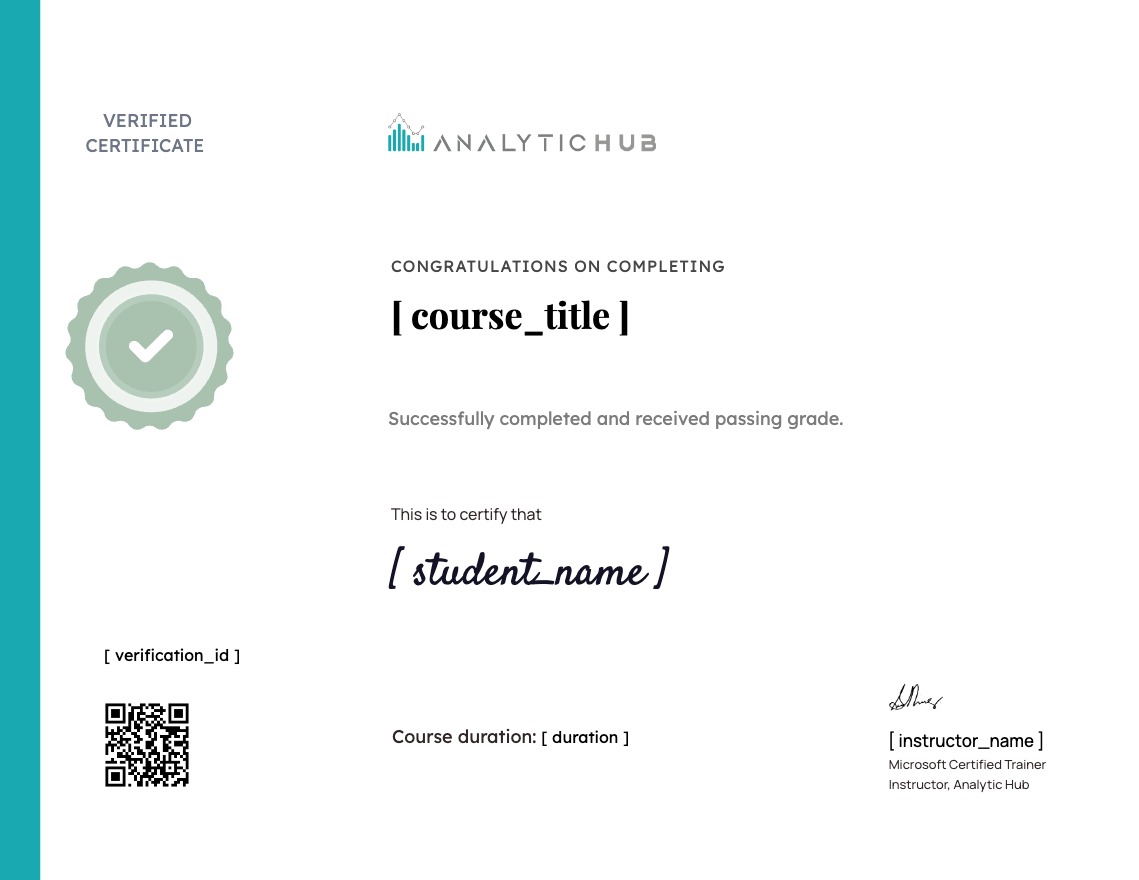
Earn a certificate
Add this certificate to your resume to demonstrate your skills & increase your chances of getting noticed.
Student Ratings & Reviews
Material Includes
- Desktop
- Internet
- Power BI Desktop
Target Audience
- Corporate
What You’ll Learn
- Create stunning dashboards.
- Make data-driven decisions confidently.
- Analyze and visualize complex data.
Pricing and Enrollment
Master Data Analysis with Power BI
-
LevelIntermediate
-
Total Enrolled113
-
Duration8 hours
-
Last UpdatedSeptember 21, 2025
-
CertificateCertificate of completion
Why Choose Us
- Affordable pricing
High-quality training at a cost that fits your budget.
- Live, interactive sessions
Engage directly with the instructor for a hands-on learning experience.
- Microsoft-certified instructor
Learn from an expert with globally recognized credentials.
- Industry-relevant curriculum
Practical lessons tailored to real-world business needs.
About the Instructor
Meet Samiul Huq (MCT) — a Microsoft Certified Trainer with over 15 years in Business Intelligence. He has consulted for bKash, JTI, and Unilever Indonesia. His mission: to help you not just learn tools, but think with data, and make you workplace-ready.
8+ years
3,000 +
Student
Microsoft
Certified
Trusted by Industry Leaders
Our proven methods and expertise have been trusted by professionals and companies worldwide.
Microsoft Power BI Training FAQs
Power BI is a BI tool for analytics. This tool allows users to aggregate and share data with reports, visualizations, and other analytics tools. It helps you create reports and charts for business insights. Power BI is available in Windows desktop app, online cloud-based software as a service, a report builder, a report server, a visual marketplace, and mobile apps for Windows, iOS, and Android tablets and smartphones.
Microsoft Power BI is a popular choice among business intelligence tools because it is easy to understand, even for non-technical professionals. Users don’t need advanced skills in data analytics or engineering to use it.
Yes, access to the Power BI Training Course material will be available for a lifetime once you have enrolled in the course.
Yes, Power Query is a significant part of the Power BI course syllabus. Participants learn to use Power Query for data transformation, cleaning, and shaping before importing it into Power BI.
A Power BI Developer is a professional who specializes in using the Power BI toolset to design, develop, and implement business intelligence solutions. They create interactive reports, dashboards, and data visualizations to help organizations make data-driven decisions.
Share Your Info to Learn More
Are you ready to transform your Excel skills into powerful data storytelling? Click “Enroll Now” or message us on WhatsApp to reserve your spot. Don’t miss out; the orientation class is on October 4, and seats are limited.